
Who are the people in your neighborhoods? NYC immigrants by the numbers
Leave a commentFebruary 5, 2013 by Noel Pangilinan
The U.S. Census Bureau started releasing the result of the 2010 Census beginning this month.
Several states, including New Jersey, have already received the results of the most recent census of population totals and demographic characteristics. As of Feb. 14, however, the state of New York still has to receive a copy of the report. Although no date is set for the New York release, the Census Bureau said on its website that all 50 states will receive the data by April 1.
Meanwhile, this is an opportune time to revisit the numbers of the 2000 Census to fully appreciate the diversity of New York City’s population, with particular focus on three Queens neighborhoods – Woodside, Jackson Heights and Elmhurst.
We love New York
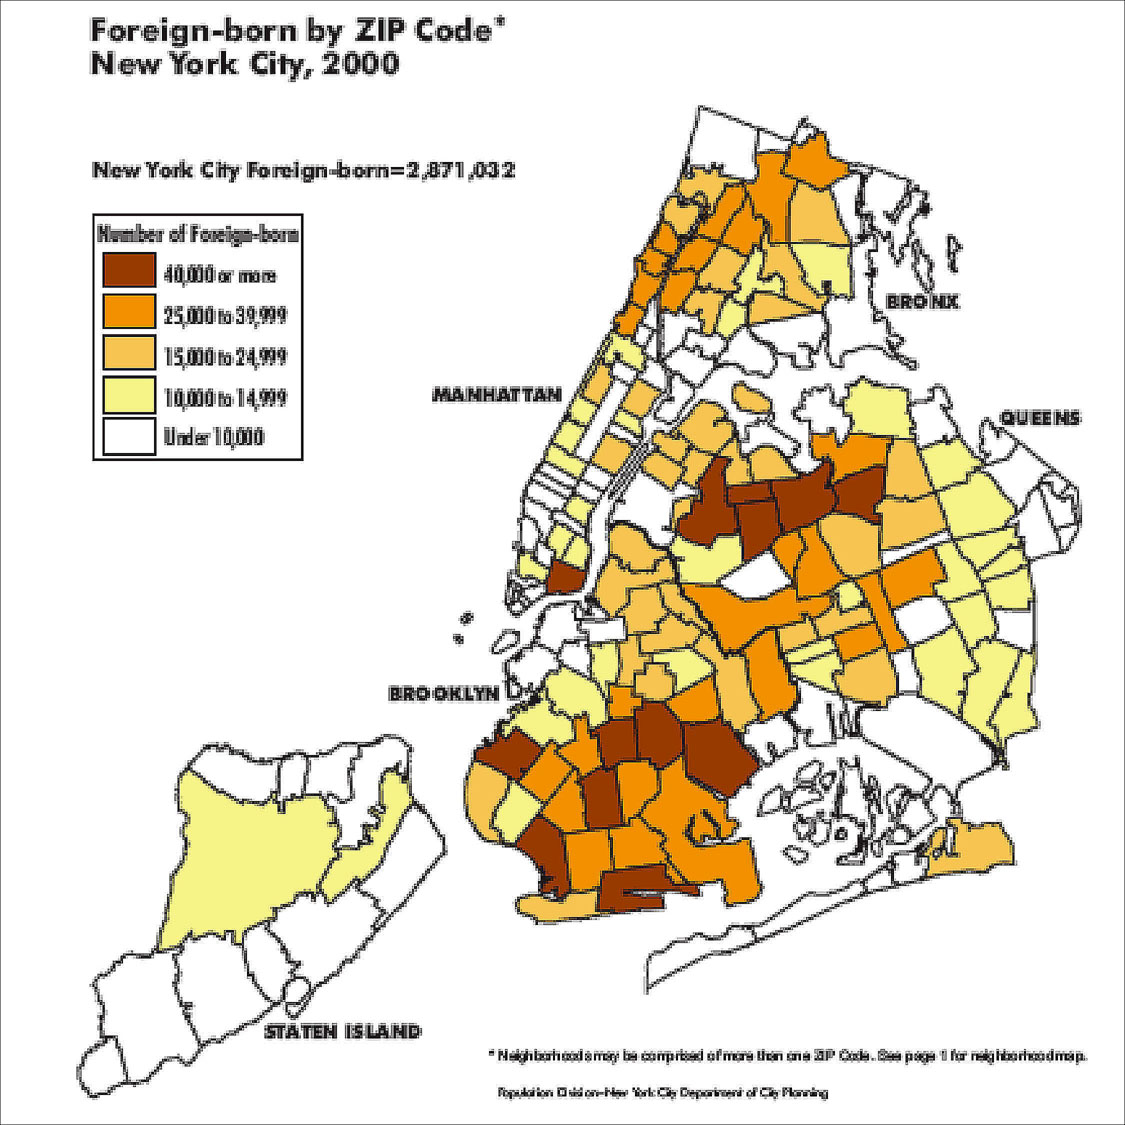
According to the 2000 Census, out of the 8 million people in New York City, 2.9 million or 36 percent are immigrants. In comparison, only 11 percent of the total U.S. population is foreign-born.
The city’s department of city planning, in its report, The Newest New Yorkers 2000, said that nearly one-third of the city’s immigrants come from Latin America. Asians in New York City account for 24 percent, while non-Hispanic Caribbean immigrants make up 20 percent, followed closely by European-born immigrants who comprise 19 percent.
The countries with the most immigrants in New York City, as of the 2000 Census, are:
- Dominican Republic, 369,200

- China, 261,600
- Jamaica, 178,900
- Guyana, 130,600
- Mexico, 122,600
- Ecuador, 114,900
- Haiti, 95,600
- Trinidad & Tobago, 88,000
- Colombia, 84,400
- Russia, 81,400
- Italy, 72,500
- Korea, 70,800
- Ukraine, 69,700
- India, 68,300
- Poland, 66,000
- Philippines, 49,600
- Bangladesh, 42,900
- Pakistan, 39,200
- Honduras, 32,400
- Greece, 29,800
(Source: The Newest New Yorkers 2000, produced by the Department of City Planning of New York City)
Queens is king
Among the five boroughs of New York City, Queens is the most ethnically diverse, both in terms of total immigrant population and in terms of immigrants-to-overall borough population ratio, according to The Newest New Yorkers 2000.
The census shows that of the 2.9 million foreign-born residents of the city, over a million live in Queens. Brooklyn comes in second with 931,800 foreign-born residents.
According to the city planning report, 46 percent of Queens’ population is foreign-born. In Brooklyn, immigrants account for 38 percent of the population; 29 percent both in Manhattan and the Bronx; and 16 percent in Staten Island.
In terms of neighborhoods, Washington Heights in Manhattan may have the largest immigrant population with 90,300 as of 2000; but of the next nine largest immigrant neighborhoods, five are in Queens.
Flushing is second with 86,900; Astoria, third, with 84,700; Elmhurst, fifth with 74,600; Jackson Heights, eighth, with 64,200; and Corona, ninth, with 61,400.
Among New York City neighborhoods, Elmhurst in Queens has the highest share of immigrants per total population. Seventy percent of its residents are immigrants. Other top neighborhoods in this category are all in Queens – Jackson Heights, Flushing, Corona and Woodside. In these neighborhoods, six out of 10 residents are born outside of the U.S, according to the same report.
In Queens, the Latin Americans and the Asians equally combine for two-thirds of the immigrant population. Non-Hispanic Caribbeans and Europeans each account for one-sixth of the total. The Chinese are the largest group, making up 10 percent of the immigrant population. The Guyanese and Ecuadorians each account for 7 percent, according to the census.
Nabes as enclaves
In Queens’ Community District 2, where Woodside is included (together with Sunnyside and Long Island City), Ecuadorians are the biggest Hispanic community, with 6,400 residents in 2000. The Mexicans are the second largest, with 6,100, followed by the Colombians with 5,900. (See chart)
Other big Hispanic populations are from Puerto Rico (3,600), Dominican Republic (3,000) and Peru (1,400).
China is the number one country of origin among Asian immigrants in the district, with 7,600, followed by the Korea with 6,800 and India with 5,600. Filipinos are the fourth largest Asian group, with 3,500, while Bangladeshis are fifth with 2,500.
In Community District 3 that groups Jackson Heights with East Elmhurst and North Corona, the Dominican Republic is the number one source of Hispanic immigrants, with 17,100. The Colombians are second with 13,800; Ecuadorians, third with 13,700; the Mexicans fourth, with almost 13,700 residents; Puerto Ricans are fifth with 6,000; and Peruvians with 3,000. (See chart)
Among Asians, Chinese are number one, with 8,300. Indians came in at second with 7,400; Koreans third with 1,800; followed closely by Filipinos with 1,700. The Pakistanis are fifth with 1,400; while Bangladeshis are sixth with almost 1,400.
In Community District 4, which covers Elmhurst, Corona and Corona Heights, the top five Hispanic populations are: Mexicans, with 14,700; Dominicans, 13,100; Ecuadorians, 12,800; Colombians, 10,400; and Puerto Rican, 5,000. (See chart)
The Chinese are the biggest Asian group in the district, with 21,800. Second are the Asian Indians, with 9,600. The Koreans are third with 6,300; while the Filipinos are fourth with 4,700. There are 1,800 Bangladeshis and 1,100 Pakistanis in the district.
The United Nations of Queens
Although immigrants from the Dominican Republic settled mostly in the Washington Heights neighborhood of Manhattan, there is also a big Dominican community in Corona, and an emerging one in Ridgewood. (See map)
Aside from Chinatown in Manhattan, the Chinese in New York have also built two more Chinatowns in Queens – one in Flushing and another one in Elmhurst. (See map)
The Ecuadorian enclaves in Queens are in Flushing, Jackson Heights and Elmhurst. (See map)
About 75 percent of immigrants from Colombia in New York settled in Queens, mostly in Jackson Heights, Corona, Elmhurst and Murray Hill. (See map)
Mexicans are mostly concentrated in Elmhurst, North Corona and Jackson Heights. (See map)
Perhaps inspired by the success of their Koreatown in midtown Manhattan, the Koreans have set up a newer enclave in Flushing that stretches east all the way to Bayside. (See map)
The Asian Indian population has grown in Richmond Hill, Ozone Park, Queens Village, Jackson Heights, and Elmhurst. (See map)
Forty-eight percent of Pakistanis in the U.S. lives in New York City. In Queens, Pakistani communities can be found in Astoria, Flushing and Jackson Heights. (See map)
Fifty-two percent of Bangladeshis in the U.S. lives in New York City. They are concentrated in Astoria, Elmhurst, Jackson Heights and Jamaica. (See map)
More than half (54 percent) of Filipinos in New York City lives in Queens. Neighborhoods with large Filipino populations include Elmhurst, Jackson Heights, Jamaica, and Woodside, where a strip of the main thoroughfare, Roosevelt Avenue, is known as Little Manila. (See map)
(Originally posted on Feb. 11, 2011. Reprinted from Queens7.com)

